


Introducing Symmetric Evaluation
A new term of art and accompanying software tool

In the post, I want to propose the addition of a new technical term into the evaluator’s lexicon of evaluators: symmetry. I think we should call an evaluation (structurally) symmetric if it meets the following conditions: 1) it posits non-arbitrary criteria and standards (collective, benchmarks) by which to judge the evaluand, 2) it gathers performance data relevant to these criteria, and 3) performance data and the criteria are compared in order to estimate the probability that the evaluand differs from the criteria and in which direction it differs.
Summative and formative evaluations can be symmetric, as can process and outcome evaluations. Goal free, utilization-focused, and empowerment evaluations can all be symmetric. Experimental designs are often symmetric, but just as often aren’t because they fail to articulate meaningful criteria. Product, program, and personnel evaluations can all be symmetric. Symmetric evaluations can and usually will include both qualitative and quantitative elements. Symmetry, then, is orthogonal to most standard typologies of evaluation—it can apply across paradigms, purposes, and methods.
The reason that I propose introducing this term to our lexicon is to draw a boundary between evaluations that meet the criteria above and those that do not. Asymmetries result in some characteristic problems:
Use of arbitrary benchmarks: undercuts the legitimacy of evaluation, causes good evaluands to be judged poorly and gives bad evaluands a pass
Inadequate connection between benchmarks and performance data: failure to measure what we really care about, usually discussed as an issues of poor or cheap design
No direct comparison between performance data and benchmarks: the final judgment step of the evaluation is left incomplete or handed off to the client to decide for themselves, abdicating the evaluator’s central responsibility
Comparison between performance data and benchmarks is non-probabilistic: exceeding the benchmark or failing to meet it is treated as a categorical win/lose without regard for the strength of evidence brought to bear, most commonly manifested as the failure to make direct statements about probability (e.g., using marginal likelihoods such as p-values instead).
Example
At this point, an example is instructive. Suppose you are doing an evaluation of a program that helps people quit smoking. What are the criteria and standards that this program be held to? There is not a single answer to this question. As for criteria, quit rate is an essential criterion. However, there are some secondary criteria that are probably valuable as well, like user experience, long-term cessation, and avoidance of harmful substitutions. For the standard quit rate, we could look at the quit rate of the most successful program ever, but what if that program is very expensive, much more costly than our current budget? Worse, what if the success of that program was due to a confluence of factors that have proven very hard to replicate: the best staff, a very willing group of participants, a hefty budget to help the program avoid potholes, and the right cultural conditions. The program with the highest quit rate (67%) that I've ever heard of is the Mayo Clinic's Intensive Tobacco Treatment Program, which features intensive inpatient care, behavioral supports, and medication. Patients attend the program 8 hours per day Monday through Friday. We should think carefully before we claim that a new smoking initiative that costs a fraction of what the Mayo Clinic's does should be judged a failure if it doesn't achieve a 67% quit rate.
Our choice of criteria and standards matter because they make evaluative judgments explicit. If we choose the wrong benchmarks at this step, the downstream evaluative judgments are doomed. After additional research I uncover some other 6-month quit rates for successful programs:
Mayo Clinic, outpatient: 28%
Ottowa Model: 35%
Baby & Me Tobacco Free: 60%
Quit Genius app: 27.5%
EX Program: 52%
We could proceed by choosing the quit rate that belongs to the program most similar to the one we are presently evaluating, ignoring all the other quit rates, or we could try to make use of all the available information in setting our benchmark.1 If we weight the rates equally (assuming exchangeability), formalize them as beta distributions, then pool them we get a mean distribution with a quit rate of about 41% and a 95% credibility interval of 27.0% to 54.0%. Now the benchmarks for the program are represented as a distribution, rather than as a single point. Immediately, we derive utility from this: if the program has a higher six-month quit rate than 54% of participants, then under our model it is in the top 2.5% of of our benchmark distribution. We know this without collecting any performance data.2
If an evaluation is symmetric, however, we go on to collect performance data. Say that we run the study and determine that the six-month quit rate is 56%, modeled as a beta distribution with a 95% CI of 54% to 58%. This outperforms the benchmark average of about 41%, but it doesn't outperform all the programs in our sample. Is this the dreaded ambiguous evaluation result? Actually, it isn't, since we can calculate the probability that our distribution of performance data is greater than the benchmark distribution: 93%. That is, there is a 93% probability that the new program outperforms our benchmarks.3
Once we arrive at this result, I would call our evaluation "symmetric": on the one side, we have legitimate benchmarks and other side of the balance we have performance data. At the fulcrum, we have a direct comparison in terms of probability.
Symmetric: Evaluation Intelligence

I think that symmetry is a very desirable characteristic of evaluations. Here are a few straightforward benefits:
Clarity about benchmarks
Use of full information available about benchmarks, along with contextual information
Easily interpretable results for stakeholders in terms of probability
Clearer role for both qualitative and quantitative methods in the standard evaluation workflow
Multidimensional criteria are easier to represent, since our level of evidence about them shares a common metric, i.e., probability or odds ratios
When I explain this way of doing evaluation to both evaluators and stakeholders, they express enthusiasm because it seems more intuitive than the more common methods. However, one thing I hear consistently from evaluators is that they would need support in implementing such a method because it differs so markedly from their training in both evaluation theory and methodology. For the last several months I've been designing and building a website that can guide evaluators though the evaluation process in a theoretically-cogent way. Today, I'm making that website available as a bundled benefit for Annual Plan subscribers to this Substack. For non-Annual users, I'm charging $5 monthly to start. These fees are meant to cover my hosting and compute costs, which can be quite high for a site this sophisticated. So, what does the site do?
The site guides users through a five-step process of conducting an evaluation: Define, Benchmark, Measure, Analyze, and Report. I'll walk through each of these steps briefly here, then do some in-depth follow-ups later. Right now, the site is fully-featured and fully functional, but there are also more features planned for each of these steps.

Define
The first step in the evaluation process is to define what you are evaluating. The Define page offers several tools to help you refine your understanding of the evaluand. This page features:
An Conversation Assistant that guides you in a focused, partly-scripted philosophical conversation with a specially-trained AI.
A Scratch Pad, which is a persistent tool that saves text to your account even when you navigate away from the page or log out. Only you can access your Scratch Pad. As you refine your evaluation, the Scratch Pad will be available throughout the site.

The Evaluation Archetypes tool, which guides you in writing your first sentence about the evaluand, once you decide what type of thing you are evaluating.
A Definition Reviewer, which allows you to paste a drafted definition and select a review type: Function, Materiality, Connection, or Change, so that a specialized AI can critique your definition and suggest improvements.

Benchmark
The second step in the symmetric evaluation process is to select the criteria and standards (collectively, benchmarks) for the evaluation. These follow directly from the definition of the evaluand. If you pasted your definition of the evaluand into the Scratch Pad, it will follow you to the Benchmark page for you to continue to work on here. In addition to the Scratch Pad, this page features:
A Conversation tool, which provides a guided conversation experience about criteria and standards.
The Benchmark Distributions tool converts plain-language statements about standards into pooled probability distributions. You can input information in various formats such as "85% satisfied," "9 in 10 satisfied," or "92 out of 96 satisfied." The specially-trained AI will process these statements and produce a probability distribution that reflects the combined information.
The tool offers a basic interpretation of the distribution, including a 95% credibility interval. The Benchmark Distributions Tool is particularly useful when you want to combine multiple potential standards into a single summary of all available information.
The Prior Interpreter tool builds on the Benchmark Distributions tool by allowing you to crowdsource judgments about criteria from a wide range of stakeholders, including experts. This tool is especially helpful when standards are unclear, contentious, or dependent on specialized knowledge.
You can collect plain-language statements from stakeholders via surveys, interviews, or live polls. When participants submit their inputs, they can indicate whether they consider themselves experts in the field. Simply paste the statements they make into the Prior Interpreter, separated by commas or periods. The Prior Interpreter processes inputs in two stages: first, it identifies and quantifies standards from each statement, providing transparency by showing how each input contributed to the distribution. Second, it flags the inputs provided by experts. A key feature of this tool is the Expertise Multiplier. By default, all inputs are weighted equally (multiplier = 1). However, if you wish to give more weight to expert opinions, you can increase the Expertise Multiplier. For example, setting the multiplier to 3 will give expert opinions triple weight.4 This feature is useful when expert knowledge is particularly valuable or when the evaluation context justifies prioritizing specialized expertise. The results section displays the differences between expert and non-expert opinions and provide interpretations of key statistics derived from the distribution.

Measure
The Measure step is about selecting or creating data collection tools that gather the information needed for your evaluation. This step bridges the gap between your criteria and standards, defined in the Benchmark stage, and your analysis. On this page, you can discuss your benchmarks with the Conversation assistant, which is trained to guide you through step. The assistant can help you generate survey items or develop rubrics based on the benchmarks you’ve identified, as well as any other variables your evaluation needs to consider. The Scratch Pad follows you to this page as well.
The utilities on this page are designed to assist in creating both qualitative and quantitative data collection tools. Right now, two primary tools are available:
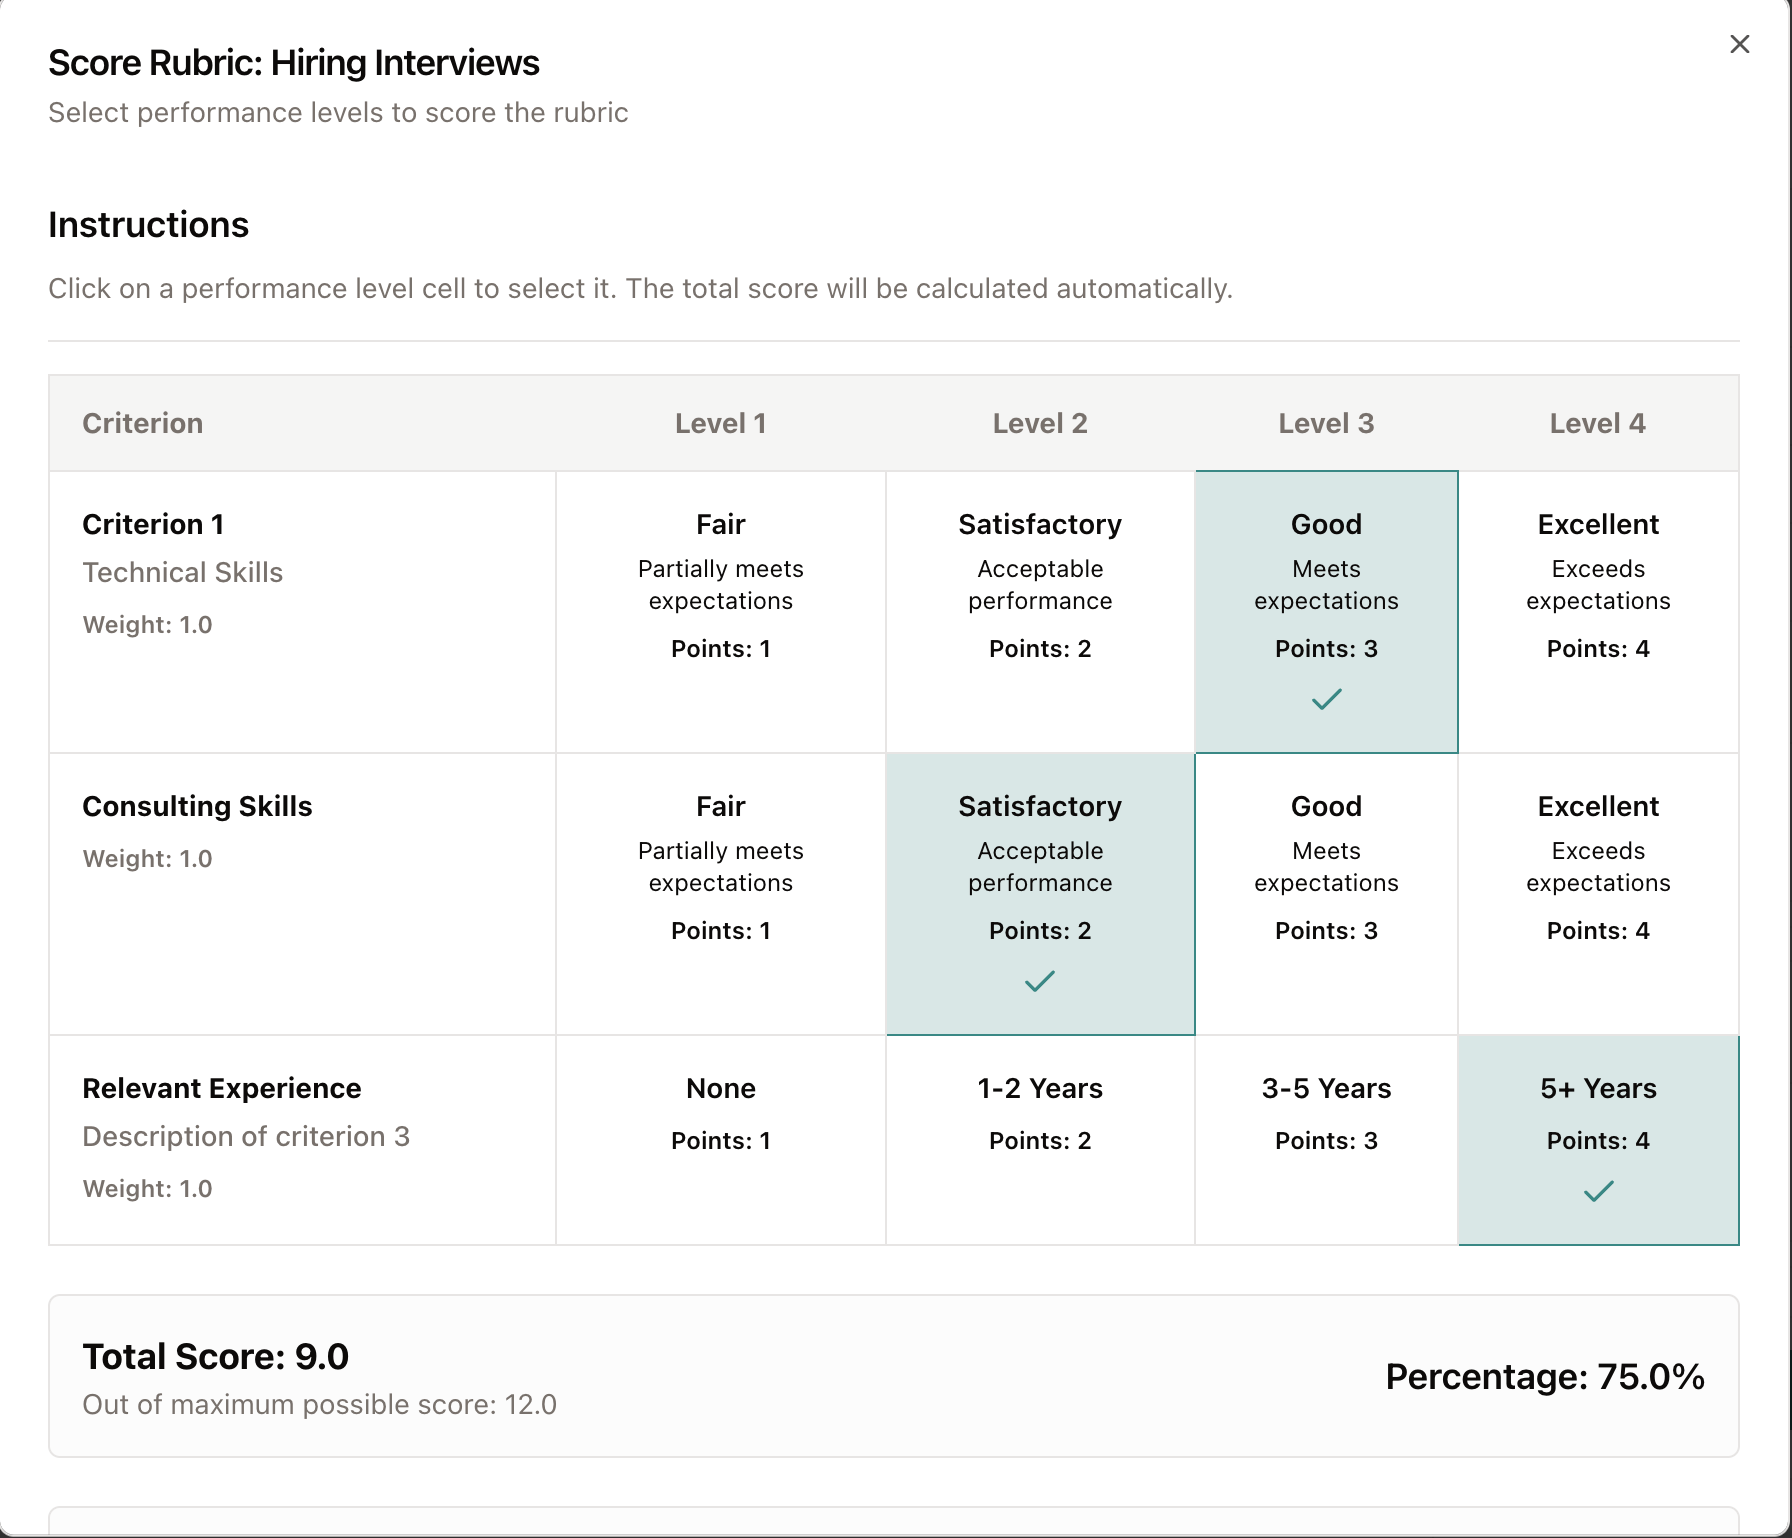
The Rubric Builder is a comprehensive tool that allows you to create rubrics by setting a title, providing descriptions, adding criteria, and defining the number of scoring levels for each dimension. For instance, you might score dance performances based on technique, performance, and choreography, with five levels for each category, each uniquely defined. Once you finalize your rubric, selecting the Finish button will display the completed rubric and allow you to download it as a table. Alternatively, you can proceed to Use Rubric to score the evaluand in real time. As you review each performance, you can select store each score when you are ready.
The Survey Improver is an AI tool designed to provide detailed feedback on your survey items. Simply paste your survey items into the tool and specify the type of feedback you seek. The tool will offer targeted recommendations to help you improve your survey. Treat the Survey Improver as an expert collaborator, guiding you toward building a better instrument.
Analyze
The Analyze page is where the performance of the evaluand confronts the benchmarks you determined in the second step. There are several ways this comparison can occur.
The most intuitive approach is to ask whether, on average, the evaluand outperforms the established standard. Rather than providing a simple yes or no answer, we can use information from the performance sample and the distribution of benchmarks to determine the probability that the evaluand has outperformed the benchmark distribution.
If the data are structured in a binary fashion, this can be done with an A/B test or a multi-armed bandit. The former applies to a two-group scenario, while the latter applies to a multi-group scenario. Continuous data can be handled using an independent-samples t-test for the two-group case and one-way ANOVA for the multi-group case. When working with rubrics, we can use a Bayesian multinomial analysis to determine the probability that the distribution of performance scores we observe is different from the benchmark distribution.

The second major way that the evaluand can confront the benchmark is when that benchmark is represented by the performance of another measured group. This commonly occurs when the benchmark is the performance of the evaluand at an earlier time point. In such cases, you can apply a paired-samples t-test or an A/B test. In efficiency studies involving many groups, the benchmark is the efficiency frontier in a data envelopment analysis (DEA). This emergent benchmark arises from the optimization of multiple inputs and outputs.
On this page of the app, all the tests listed above are available in the Methods section. Most of them can be run by simply typing in the appropriate values. Some, like the paired-samples t-test, require your data, which can be added using the Data Uploader tool at the bottom of the page. Other analysis methods allow you to input or copy data from a dataset automatically.
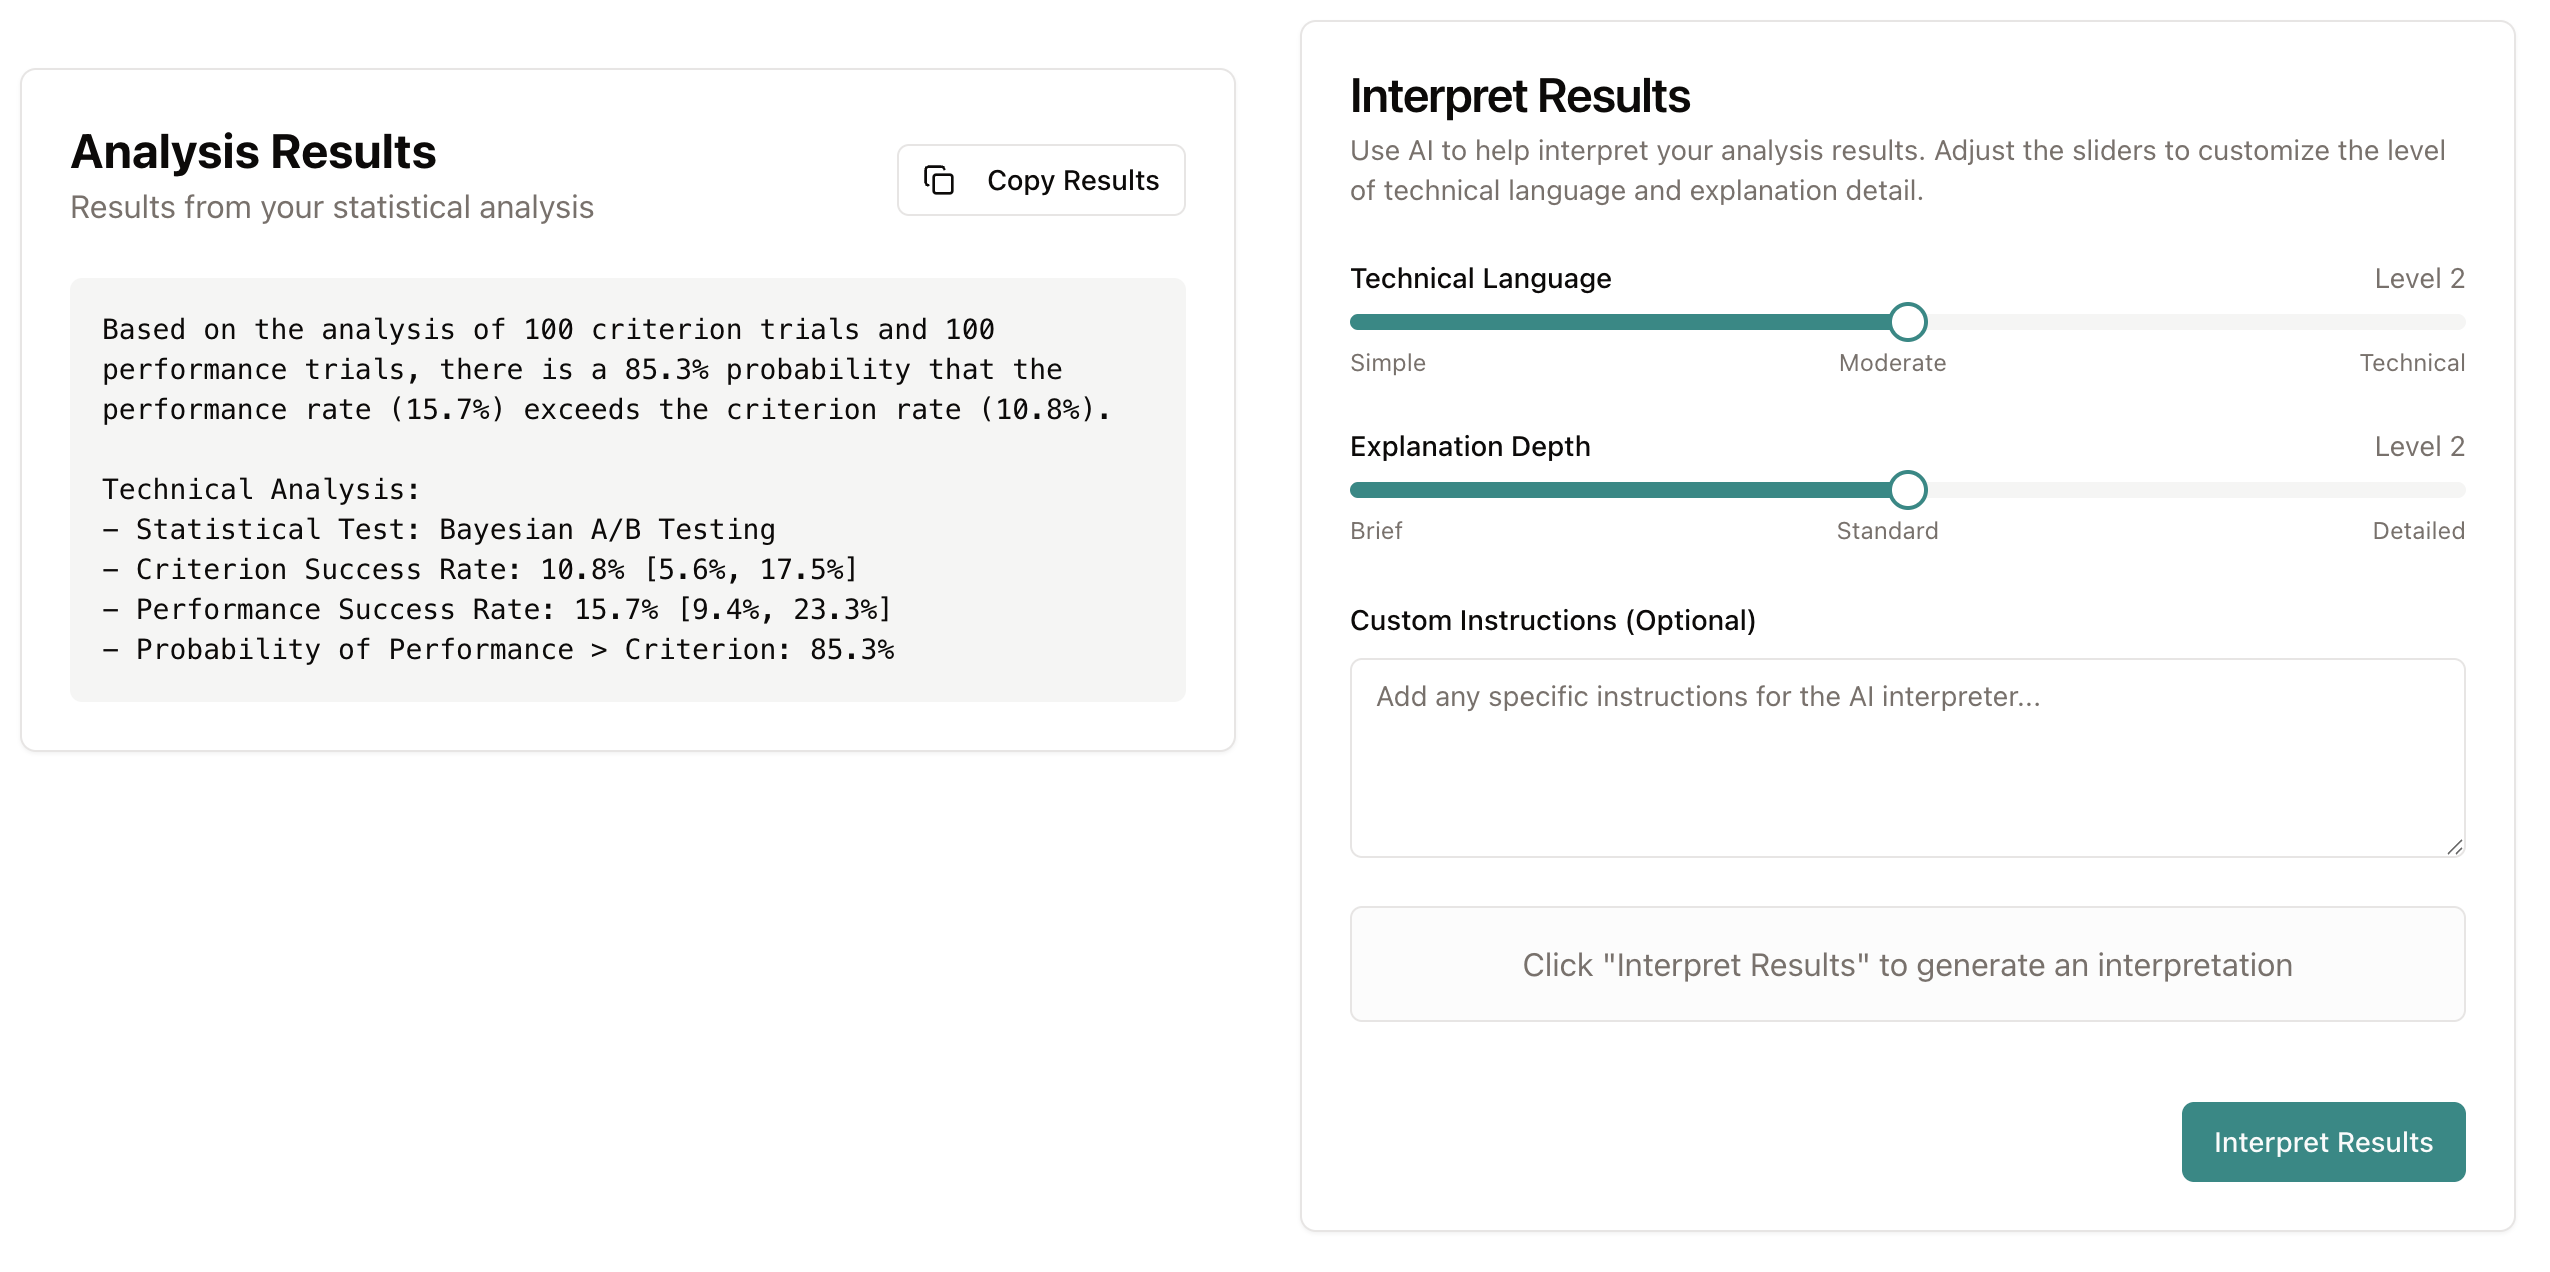
Once you run an analysis, the results will appear in the Results section below the Methods module. You can either copy the results directly or use the Interpret function to the right of the Results section. The Interpret function allows you to select the degree of technicality and depth of explanation you would like using adjustable sliders. These parameters change the way the specially-trained AI handles your request. For example, low technicality and high explanatory depth would produce the most user-friendly summary of the analysis for a beginner, while high technical language and high explanation depth would produce a thorough summary for a seasoned evaluator who wishes to review how a particular method works.
At the bottom of the page, the Data Uploader tool is used for certain analyses in the Methods module. Once the file is processed, it also automatically provides descriptive statistics for relevant variables. The Data Simulator tool produces basic datasets from scratch with predefined characteristics. This is particularly useful for testing any of the analysis methods on this page or for demonstrating what a particular dataset might look like for stakeholders.
Most methods have an Advanced Mode that can be toggled on. This mode will primarily be useful for those experienced in Bayesian statistics and offers the choice to customize priors. When Advanced Mode is off, default priors are used to reflect conservative assumptions about your knowledge state before running the tests. That is, the default priors assume you don't have any special knowledge about the outcome of the tests and are generally considered safe to use.
Report
The Report page is the final step in your evaluation process, where you transform your analysis results into clear, professional communications tailored to your audience. To begin, press Quick Draft to convert your Scratch Pad content into an evaluation report. The more detail you provide, the more context the AI will have, resulting in higher-quality drafts. Keep in mind that the Quick Draft is intended to help you organize your notes into a coherent structure, not to replace your writing style or professional judgment. Use the Technical Language and Explanation Detail sliders to adjust the kind of text generated. These work the same way as on the Analysis page (see above). The point is to get your notes to a minimum viable product immediately so that you can focus on refining the more complicated parts.
The Quick Draft tool structures your report according to the symmetric evaluation framework: beginning with an understanding of the evaluand, followed by criteria, performance, and results of comparing one against the other. If your notes lack sufficient detail to complete a particular section, the tool will indicate this by placing a note in brackets, prompting you to add more context.

The Report Tools available to help you at the reporting stage are the Stakeholder Map, the Summative Rubric, and the Notebook. The Stakeholder Map is a classic tool to help you visualize the involvement of different stakeholders in the evaluation. The Summative Rubric is a way of helping you combine multiple criteria of merit into a single summative judgment about the evaluand. It is compatible with unweighted, numeric weight and sum, and qualitative weight and sum approaches. The Notebook is a place to copy your reports for multiple projects or drafts.
The Software Pitch
Evaluators use a lot of software tools, but virtually none of them are created with us in mind. Some days, this is like trying to use a screwdriver as a hammer.
It’s time for evaluators to get into software production so that we can have the tools we need, ready at hand. This is even more important for evaluators who are early in their career or who are working on teams that include new evaluators. Software that is driven by a clear vision of the logic of evaluation, rather than by generic statistical or qualitative methodology, best supports learning.
I admire independent software developers (like Mike Linacre and Linda and Bengt Muthén) who have made major contributions to their niche intellectual communities by making accessible tools. When I asked myself what the analog to these invaluable software programs would be in evaluation, I realized that the answer would need to be something that could do both qualitative and statistical work, but which could also help us think about evaluation. It would need to be able to carry on a theoretically-disciplined dialogue with us. Until recently, the presence of a human was an absolute requirement for this, but we have hurtled past that barrier. I want to emphasize that this is not software to replace evaluators – it is software for evaluators.
If you decide to subscribe to Symmetric, I think that you will find at least one feature will help you approach your work differently. Honestly, though, the goal is bigger than that. I hope that by making the process of symmetric evaluation more intuitive and accessible that we can explore a new evaluation paradigm together. I know I’m not the only one thinking these thoughts, and I want to give more people an opportunity to contribute to this version of the future of evaluation. My hope is that by using more of the same tools, talking to each other more, and having more informed debates, we will push the field forward in an exciting new path.
We also have the option of ignoring previous program performances and setting our standards based on other information, such as the need to solve a practical problem. If I have a twenty-foot wall to climb over, I need a twenty-foot ladder, whether or not anyone actually has one right now. These standards also need to be legitimate. That is, we need to be able to point to a 20-foot wall and explain how it might be reasonable to expect building a ladder that can get to the top of it.
This is a distribution of benchmarks, not of performance data in general. This fact is very important for our inferences. What we want to know is not whether a program is better than “average” or any percentile of other programs. We want to know how it fared relative to our standards, which may be well-represented past performances or not.
Note that this is a posterior probability about parameters (θ), not about samples or populations. When we say that we are finding the probability (θ)X > (θ)Y, there is no model-based notion of sampling variability involved, only epistemic uncertainty about the true parameter values (θ)X and (θ)Y. We are working within Bayesian decision theory and in a longer exposition we will want to state our decision rules more precisely. In this paradigm, uncertainty reflects our degree of belief about true parameter values, not sampling variation. This seems like a good topic for a future post.
If it helps, think of the expertise multiplier as an informal application of hierarchical modeling.